Owl
Observability sized for one machine: a single static Go binary, one container and one SQLite file.
The problem
Watching a single low-end host is a real need with no proportionate answer. Prometheus and Grafana solve it, but they are built for fleets and they ask for the memory of the machine they are supposed to be watching. The hosted alternatives start as a free tier and end as a sales funnel.
Dashboards are files
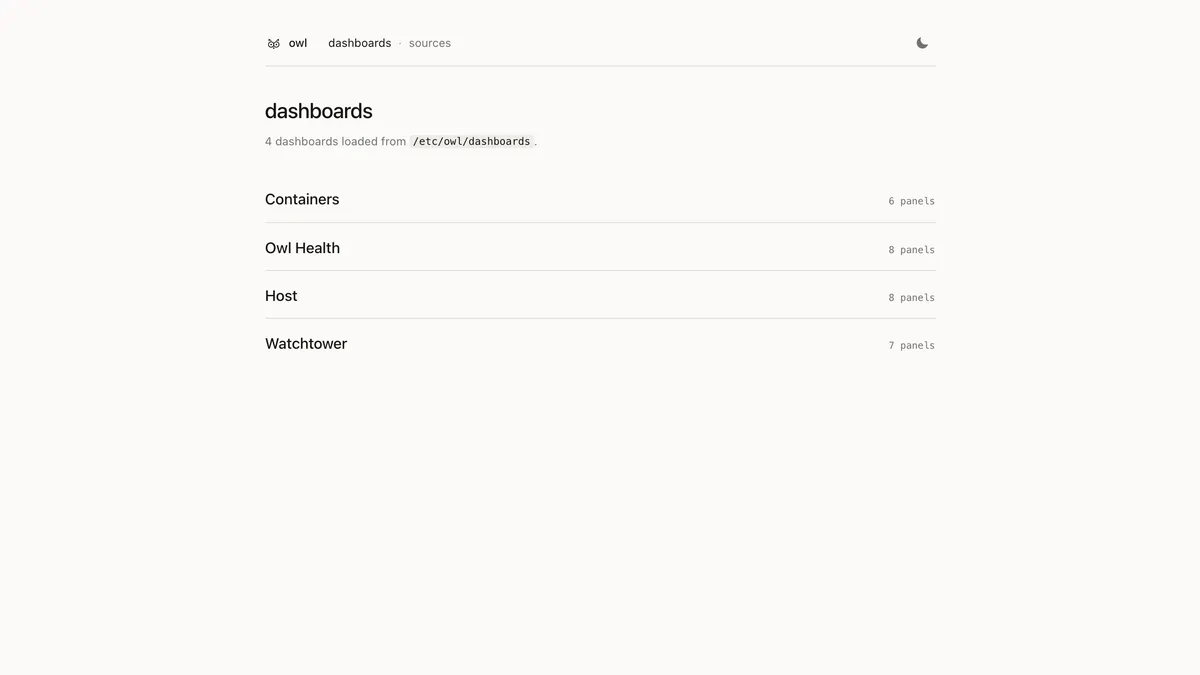
A dashboard is a JSON file in a directory, loaded at startup. Nothing is clicked together in a UI and nothing lives in a database that has to be backed up separately: the configuration of the whole system sits in version control, next to the code that deploys it.
A deliberate subset
That file format is a subset of Grafana’s own dashboard JSON, so an export
usually drops straight in and renders; whatever Owl does not understand is
ignored without complaint. There are four panel types (timeseries, stat,
gauge and a tabular events) and that is the whole catalogue: no heatmaps,
no bar gauges, no pie charts. A panel it cannot draw explains itself in place
of the chart, and the rest of the dashboard still works.
Queries go through its own PromQL parser instead of Prometheus’s: the counter
functions (rate, irate, increase, delta), the _over_time family,
histogram_quantile, topk and bottomk, five aggregations with by and
without, the four label matchers and plain arithmetic. No subqueries, no
offset, no vector matching modifiers, no template variables. Anything outside
the subset comes back as an error naming the construct it refused, which beats
a silently empty chart.
What it collects
It scrapes any endpoint that speaks the Prometheus text format on an interval and writes the samples to SQLite, with a retention policy that drops data either past a time window or past a size cap, whichever comes first.
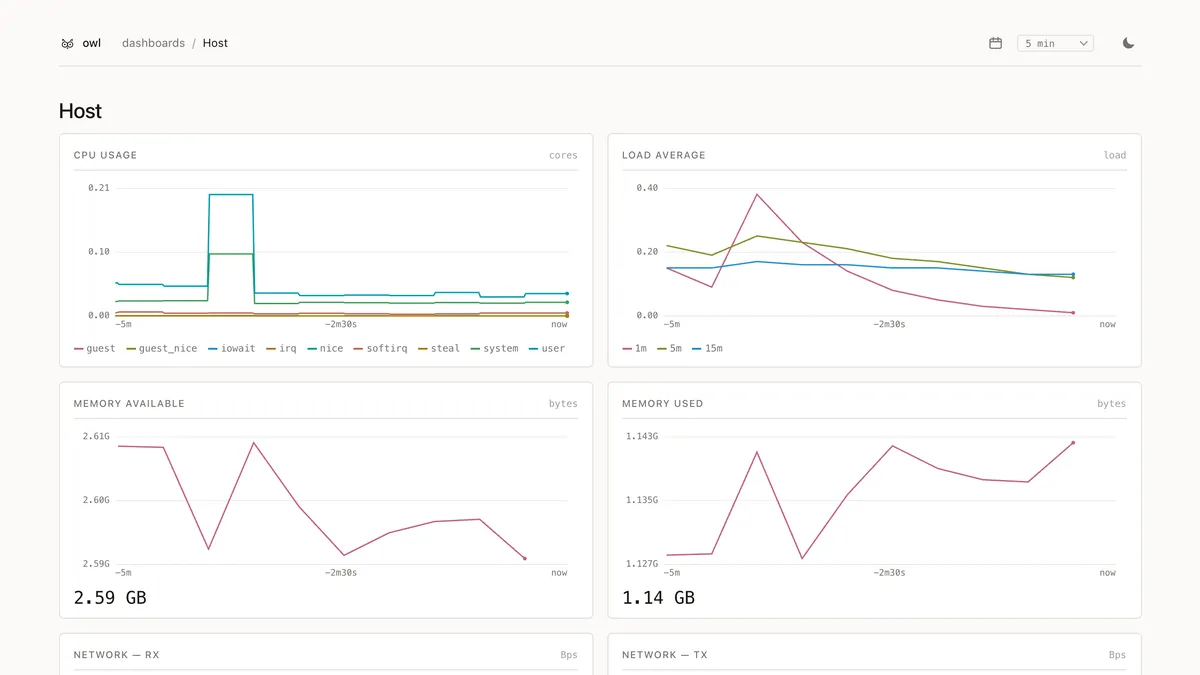
Two optional collectors cover the usual questions about a host: one reads
/proc for CPU per mode, load average, memory, network and disk; the other
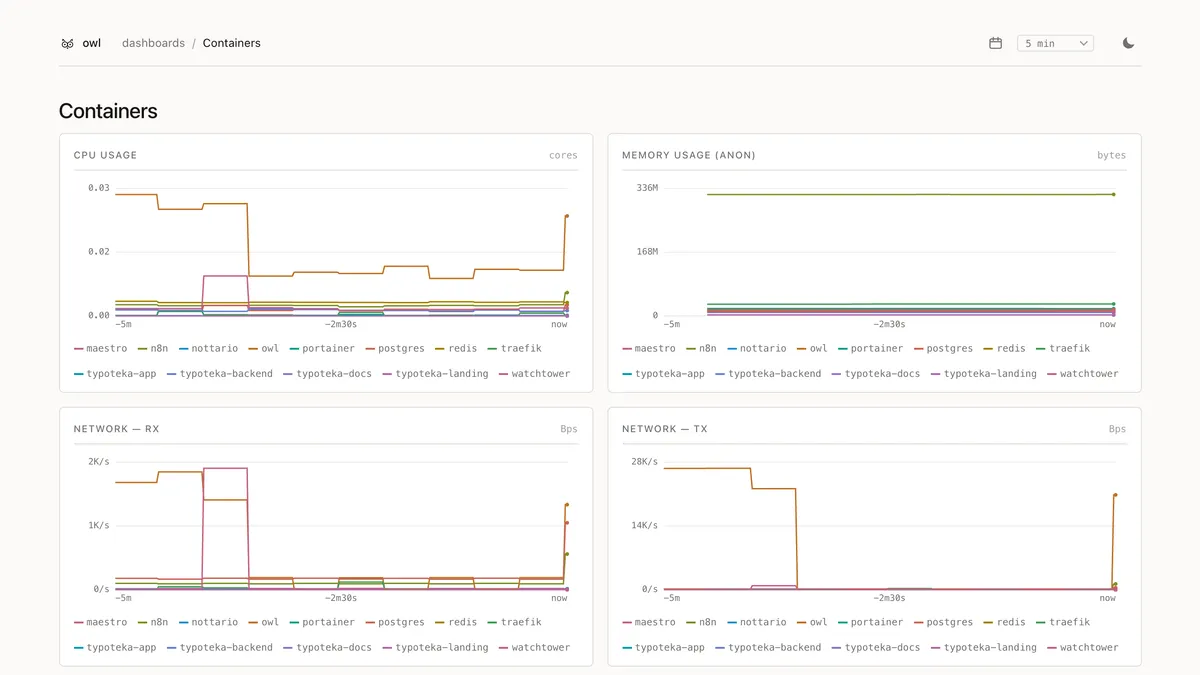
talks to the Docker socket for per-container metrics, and discovers new
targets from container labels instead of edits to the config file.
It watches itself
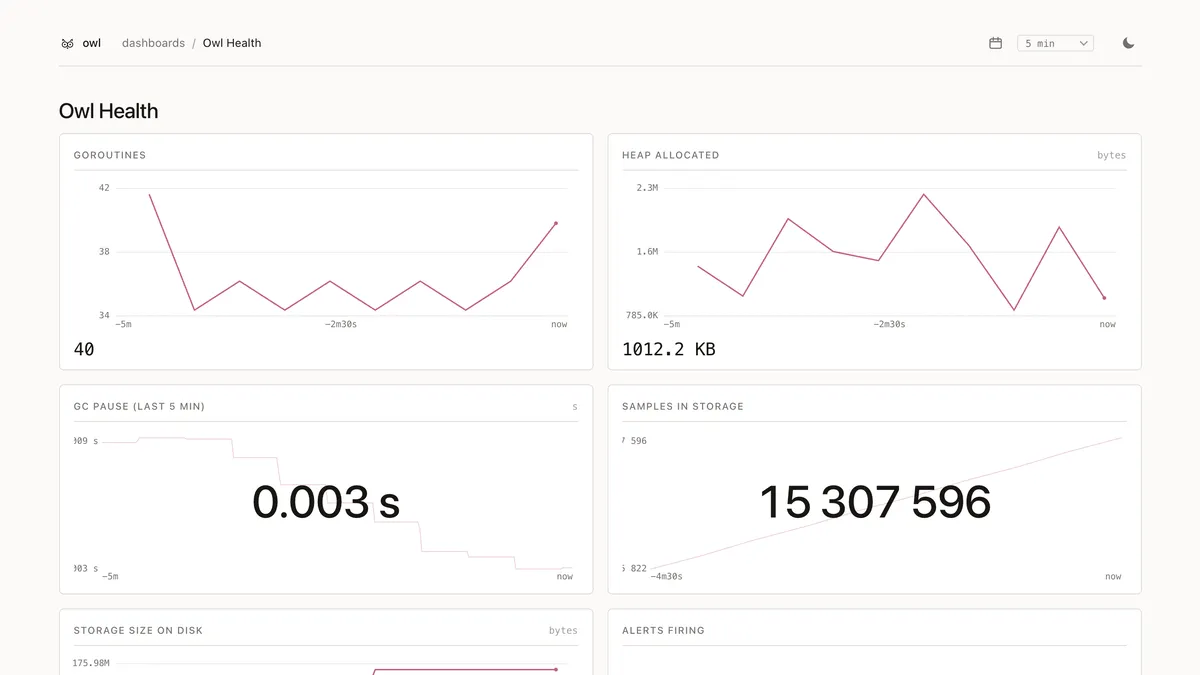
Owl exposes its own metrics in the same format it consumes, and scrapes itself by default: goroutines, heap, GC pauses, stored samples, database size. If the thing that watches everything else goes quiet, that shows up on a dashboard rather than in a surprise.